Using minitab Study guides, Class notes & Summaries
Looking for the best study guides, study notes and summaries about Using minitab? On this page you'll find 54 study documents about Using minitab.
Page 2 out of 54 results
Sort by
-
Solution Manual for Basic Statistics in Business and Economics, 10th Edition By Douglas Lind, William Marchal, Samuel Wathen
- Other • 3 pages • 2024
- $20.49
- + learn more
Basic Statistics in Business & Economics provides students majoring in management, marketing, finance, accounting, economics, and other fields of business administration with an introductory survey of descriptive and inferential statistics. Many examples and exercises that focus on business applications are used to illustrate the application of statistics, but also relate to the current world of the college student. A previous course in statistics is not necessary, and the mathematical requirem...
-
Exam (elaborations) INSTRUCTOR'S SOLUTIONS MANUAL to Accompany James T. McClave P. George Benson and Terry Sincich's_STATISTICS FOR BUSINESS AND ECONOMICS 10th Edition
- Exam (elaborations) • 567 pages • 2021
- $15.49
- + learn more
Exam (elaborations) INSTRUCTOR'S SOLUTIONS MANUAL to Accompany James T. McClave P. George Benson and Terry Sincich's_STATISTICS FOR BUSINESS AND ECONOMICS 10th Edition Statistics for Business and Economics, ISBN: 2655 INSTRUCTOR'S SOLUTIONS MANUAL to Accompany James T. McClave P. George Benson and Terry Sincich's STATISTICS FOR BUSINESS AND ECONOMICS Tenth Edition Nancy S. Boudreau Bowling Green State University Upper Saddle River, New Jersey Columbus, Ohio To download more sli...
-
STA1502 inferential-stats-1b-the-course-notes-for-statisticalinference.
- Exam (elaborations) • 115 pages • 2022
- $3.49
- + learn more
ORIENTATION iii STUDY UNIT 1 1.1 Introduction 1 1.2 Inference about the Difference Between Two Population Means: Independent Samples 1 1.3 Observational and Experimental Data 9 1.4 Inference about the Difference Between Two Population Means: Matched Pairs Experiment 9 1.5 Inference about the Ratio of Two Variances 19 1.6 Self-correcting Exercises for Unit 1 22 1.7 Solutions to Self-correcting Exercises for Unit 1 23 1.8 Learning Outcomes 27 STUDY UNIT 2 2.1 Introduction 28 2.2 In...
-
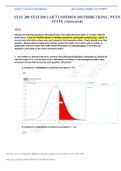
STAT 200 STAT200 LAB 7 COMMON DISTRIBUTIONS - PENN STATE (Answered)
- Exam (elaborations) • 7 pages • 2021
- $7.29
- 1x sold
- + learn more
(answered) STAT 200 STAT200 LAB 7 COMMON DISTRIBUTIONS - PENN STATE STAT 200 Lab 7 Common Distributions STAT 200 STAT200 LAB 7 COMMON DISTRIBUTIONS - PENN STATE NAME: Answer the following questions showing all work. Full credit will not be given to answers without work shown. If you use Minitab Express or StatKey include the appropriate output (copy + paste). If you do hand calculations show your work using the Word equation editor. Clearly identify your final answers. Output without explanation...
-
Stat455-homework 9 solution
- Other • 7 pages • 2024
- $7.99
- + learn more
Stat455-homework 9 solution: computation statistics using Minitab


-
Test Bank For Basic Statistics in Business and Economics, 10th Edition By Douglas Lind, William Marchal, Samuel Wathen
- Other • 3 pages • 2024
- $20.49
- + learn more
Basic Statistics in Business & Economics provides students majoring in management, marketing, finance, accounting, economics, and other fields of business administration with an introductory survey of descriptive and inferential statistics. Many examples and exercises that focus on business applications are used to illustrate the application of statistics, but also relate to the current world of the college student. A previous course in statistics is not necessary, and the mathematical requirem...
-
Keller MATH 533 Course Project Part B, Hypothesis Testing
- Exam (elaborations) • 13 pages • 2023
- $8.49
- + learn more
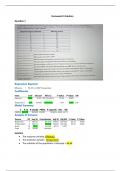
Keller MATH 533 Course Project Part B, Hypothesis Testing. Keller MATH 533 Course Project Part B, Hypothesis TestingRequirement A: The average (mean) sales per week exceeds 41.5 per salesperson. Key Statistics as computed by Minitab Variable N N* Mean SE Mean StDev Minimum Q1 Median Q3 SALES 100 0 42.340 0.417 4.171 32.000 39.250 42.000 45.000 N for Variable Maximum Range IQR Mode Mode SALES 52.000 20.000 5.750 44 12 Step 1 Hypotheses Ho: μ = 41.5 Ha: μ > 41.5 Step 2 Level of Sig...
-
MATH 533 FINAL EXAM 1- 100% CORRECT
- Exam (elaborations) • 6 pages • 2021
- $11.49
- + learn more
MATH 533 FINAL EXAM 1- 100% CORRECT MATH 533 Final Exam (TCO A) Seventeen salespeople reported the following number of sales calls completed last month. (TCO B) Cedar Home Furnishings has collected data on their customers in terms of whether they reside in an urban location. Or a suburban location, as well as rating the customers as either “good,” “borderline,” or “poor.” The data is below (TCO B) Historically, 70% of your customers at Rodale Emporium pay for their purchases us...
-
MATH 533 WEEK 7 COURSE PROJECT PART C, REGRESSION AND CORRELATION
- Exam (elaborations) • 5 pages • 2022
- $19.49
- + learn more
MATH 533 Week 7 Course Project Part C: Regression and Correlation Analysis Using Minitab, perform the regression and correlation analysis for the data on SALES (Y) and CALLS (X) by answering the following questions. Generate a scatterplot for SALES versus CALLS, including the graph of the best fit line. Interpret. Determine the equation of the best fit line, which describes the relationship between SALES and CALLS. Determine the coefficient of correlation. Interpret. Determine the coeff...
-
QNT/351 Week 5, team assignment If using the Ballard Integrated Managed Services, Inc. (BIMS) case study overview: Resource: University of Phoenix Material: Ballard Integrated Managed Services, Inc., Part 2. Read the University of Phoenix Material: Ba
- Summary • 4 pages • 2021
- $3.49
- + learn more
QNT/351 Week 5, team assignment If using the Ballard Integrated Managed Services, Inc. (BIMS) case study overview: Resource: University of Phoenix Material: Ballard Integrated Managed Services, Inc., Part 2. Read the University of Phoenix Material: Ballard Integrated Managed Services, Inc., Part 2. Your team acts as a consultant group that analyzes and interprets this second set of data. The intent is to increase senior management's understanding of the sources of employee dissatisfaction a...
